DevOpsCon 2023
My synopsis and outtakes
Intro
I have attended a DevOps Conference in Berlin and here I will try to summarize my experience and outtakes from it.
This hybrid conference was located – physically – in the heart of Berlin, at Martim Hotel near Friedrichstraße S-Bahn station. That location was very well known to me, because it was a changing station from when I went from my university to my work. So, visiting it again after several years was pleasant and nostalgic, and I’m, glad that not much has changed there - not for the worst, at least.
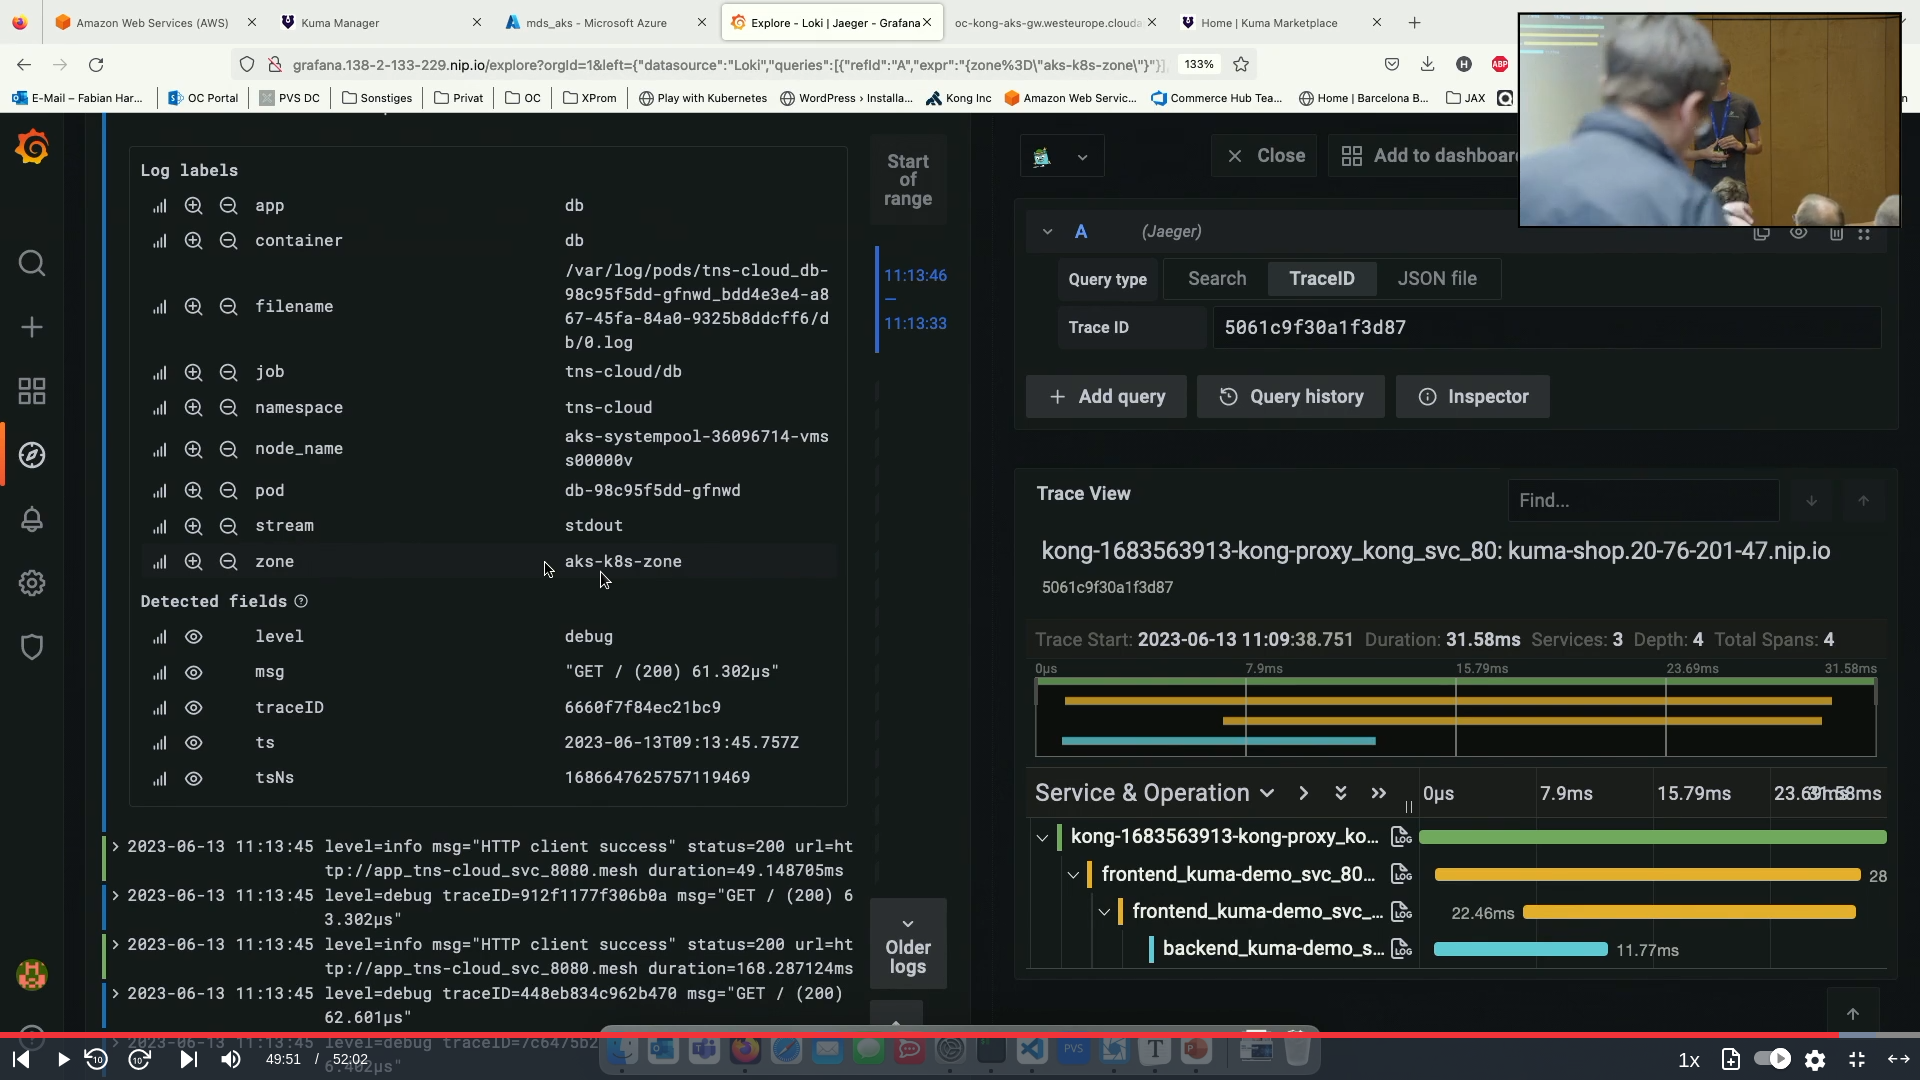
For those, who didn’t want to fly to Germany (in the middle of a massive military air training, may I add), there was an option to watch it online. Every presentation had a live stream, both slides and presenters were visible, and a dedicated moderator would read your question from the chat out loud. By the way, here’s how it looked like (with me accidentally photobombing the presenter):
 Advanced Observability & Security for your Kubernetes with a modern Service Mesh by Fabian Hardt
Unfortunately, my tier of ticket permitted me to re-watch presentation videos for only a week after the conference, so some footage that I wanted to re-watch is now lost to me. For just ~200EUR per month you can buy a “Fullstack Experience”, I believe, and have those videos available for the next 6 months.
Disclaimer
This article is a synopsis, published in good faith and for general information purpose only. All the talks are annotated with with the names and companies of presenters, as they were provided during the conference.
I do not claim ownership over any information provided here.
At the time of writing this you should be still able to purchase a “Fullstack Experience” ticket to view presentations.
Expo
Expo was located in the main hall of the hotel. It wasn’t great that most of the fridges had only sparkling water, and to find a bottle of still one you’d have to go on a quest. Can’t say anything about lunch offers, because I went to eat out on my own.
Across the hall there were several stands. Non-exhaustive list includes:
- Airlock Microgateway - lightweight security gateway for use in container-based applications; features protection against known OWASP Top 10 threats, access management with Airlock IAM, authentication check (+JWT token validation), load balancing via Airlock Gateway;
- Contrast Security - devops- (and developer) -friendly application scanner for vulnerabilities;
- Gradle Enterprise - a tool for managing all building tools (including Maven, Bazel and Gradle) that can speed build and test time and provide better visibility for improved developer performance;
- Sofy - no-code testing for mobile tools.
- Splunk - security and observability analytics platform for large scale enterprises that can do anything you need;
- Zeiss - turns out those guys also require software engineers and are hiring.
Talks (in no particular order)
Kubernetes Operators
By Iurie Muradu.
In this talk we were introduced to Kubernetes Operators, a concept, which I haven’t even worked before (but the same goes for a lot of topics from this conference, to be honest).
Operator pattern allows us to extend the cluster’s behavior without modifying the code of Kubernetes itself, by linking controllers to one or more custom resources.
An example of what k8s operator can do includes deploying applications on demand, taking and restoring backups of the applications’ state, handling upgrades of the application code, publishing a service to applications that don’t support K8s API to discover them, simulating failures in app or parts of cluster for resilience testing, choosing a leader for a distributed application without an internal member election process.
In his talk, Iurie demonstrated how to create an Operator using operator-sdk. The goal is to create an operator that would accept
apiVersion: web.phys.app/v1alpha1
kind: WebServer
metadata:
    name: webserver-sample
spec:
    webServerImage: nginx
    ingress:
        host: phys.app
        ingressClass: nginx
    persistentVolumeClaim:
        name: web
        storageClass: root-efs
        mountPath: /usr/share/nginx/html
        createIfNotExists: true
to achieve this he had defined a type WebServer, and implemented control loop in go. In the end make generate and make manifests. We got a demo on how it all works, and book recommendations for further research.
Tackling challenges in Istio and Kafka
By Kristof Gyuracz.
Did someone mention Kubernetes Operators? Because Kristof has some!
In his talk Kristof discusses pros and cons of running Kafka on Kubernetes, as well as the challenges with operating Kafka and Istio there.
He then presents the following:
• Koperator - operator for Kafka, with full lifecycle management, network and storage handling, alert based scaling and graceful rebalancing; • istio-operator - operator for Istio with lifecycle management, complex deployments and multi-cluster support; • Cluster registry controller - controller to help forming a group of Kubernetes clusters and synchronize any K8s resources across those clusters.
The talk is concluded with a Calisti demo - an app that handles Kafka and Istio related tasks, has integrated observability, SLO based alerting and has integrated UI for Istio and Kafka.
Mistakes we made in our cloud journey
By Manoj Bhagwat.
A presentation outlying a typical mistakes one can make in their cloud (or any?) journey. A list of mistakes includes:
- Using a single AWS account, with no AWS organizations and no SSO;
- Not sticking to one automation process / workflow and practices across the organization;
- Neglecting IAM (no audit updates, not using roles);
- Neglecting security (not using code scanners, not requesting pentesting, not shifting left with security);
- Not creating a documentation;
- No risk assessment, no failure scenarios, no process in place;
- No clear separation on what is internal/external resource, VPN not configured;
- Not using managed solutions, sticking to OpenSource and wasting time and money;
- No clear vision, no Defined Could Roadmap.
Advanced Observability & Security
By Philipp Kürsten, Fabian Hardt on behalf of Opiz Consulting.
This was a rather advanced talk, will do my best to write it as I understood it.
With the growing number of applications / services and clusters we face the problem of managing security, logging, metrics gathering, routing, rate-limiting and caching between services.
Service mesh is a dedicated infrastructure layer that makes service-to-service communication more reliable, secure and observable.
There exist several service-mesh implementations, like Kuma, Istio, Consul, Linkerd, and GlooMesh. This talk focused on Kuma.
Kuma provides a distributed, platform agnostic open-source Control Plane for service mesh. It comes with a bundled Envoy Proxy integration.
Presentation highlighted various modes for Kuma. With a single cluster Data Plane Proxies are attached to pods, and are coordinated via a Zone Control Plane. With multiple clusters, all traffic enters cluster ove zone ingress (setup with Kuma), with one remote zone control plane in each cluster and a global control plane for coordination.
Kuma proxies route traffic through ingress or out of egress instances. A service mesh DNS resolves “.mesh” addresses to pre-defined IP addresses. This all may work even if you need to integrate legacy VMs or bare metal services with modern clusters.
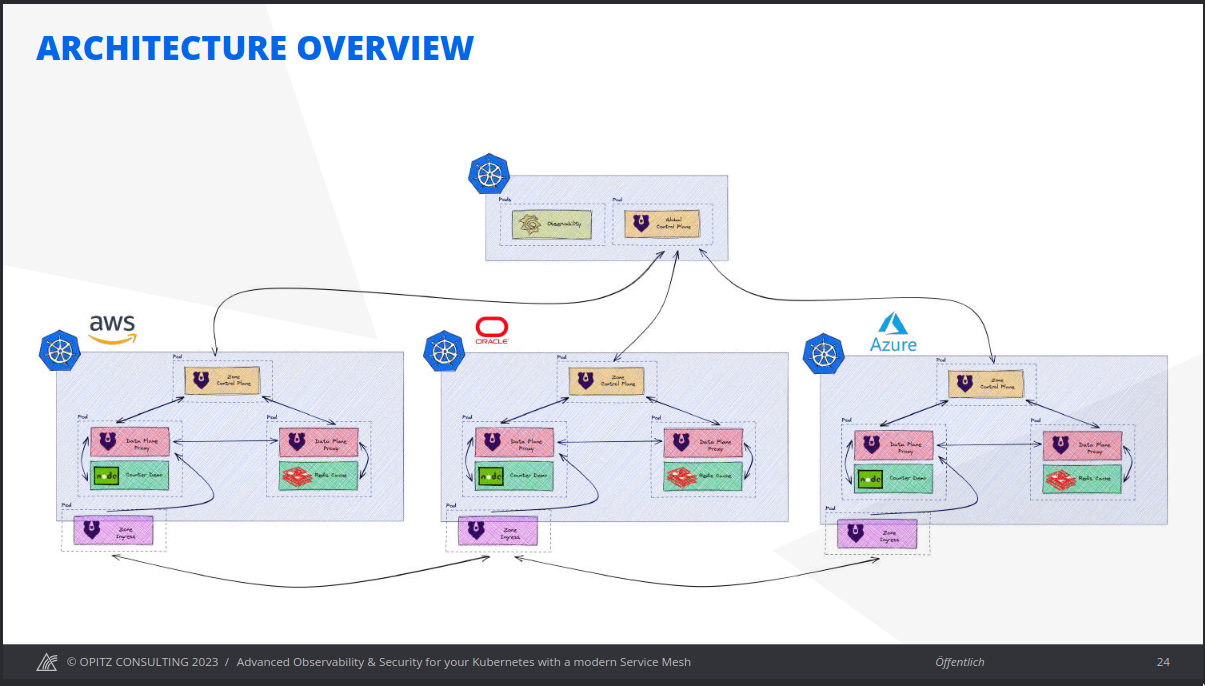 A slide from Opiz Consulting
We then got a demo on how it all works. For analyzing and monitoring the data presenters used Grafana Stack, with:
- Grafana for visualization;
- Loki for logging (log shipping by FluentD / FluentBit / Promtail);
- Prometheus for metrics;
- Jaeger / Tempo for tracing;
- Prometheus Alert Manager for alerting.
Keys takeaways is that Service Mesh is essential to build and managing multi-cloud apps efficiently, and Kuma as a service mesh provides flexible agnistic approach, seamless CI / CD integration, intuitive design and can be easily spanned over multiple clusters and clouds.
‘16 artifacts’ to capture when your container application is in trouble
By Ram Lakshmanan from ycrash.io
I didn’t personally attend this talk, however its slides were interesting enough.
16 artifacts to collect. The idea is that you don’t need to collect each and every artifact all the time, but it is a good idea to remember which tools can help you potentially debug which situation.
Linux utils:
top- processes CPU & Memory, Load average, CPU utilizationps- snapshot of specific processes, works well withtoptop -h -p <pid>- thread information withing process, works well with thread dumpdf -h- disk usage, what is mounted wheredmesg- examine kernel ring buffer, may help with high load investigationsnetstat(or it’s more modern replacementss) - info on network subsystemping- pingvmstat- report virtual memory statisticssysctl -a- kernel params
Java specific:
Garbage Collection (GC) Log - can be analyzed with a number of tools
- YCrash - as a suite
- GCeasy - a tool from YCrash guys
- IBM Garbage Collection and Memory Visualizer
- HPJMETER - outdated tool for old JVMs
- garbagecat - a log analyzer tool by Google
Thread dump - can be analyzed with
- YCrash - those guys are serious about selling
- FastThread - a tool from YCrash
- IBM TMDA - a tool from IBM
Heap dump -
- HeapHero - YCrash again
- Eclipse MAT - Eclipse project tool
- Jhat - unsupported experimental tool by Oracle
How to Prevent Your Kubernetes Cluster From Being Hacked
Talk by Nico Meisenzah. He also has a YouTube channel with a lots of different talks he gave. That includes this very talk.
In his earlier talk Nico demonstrated how an attacker might compromise your K8s cluster with a flawed docker image, and in this talk he focuses on building secure and verifiable images in order to prevent that.
Wolfi (GitHub), is a Linux OS built for conianer-native era and with focus on security in mind.
Wolfi features includes Software Bill Of Materials - a “list of ingredients” for all software dependencies (that support hierarchy). It uses apk packages that are designed to be granular and independent. It has a fully declarative and reproducible build system that can be easily analyzed by vulnerability scanners.
For image verification there is Cosign and Sigstore
Cosign signs containers using sigstore. With help of Kyverno policies are integrated with the cluster to validate source of images - if it is a third-party image, or your own.
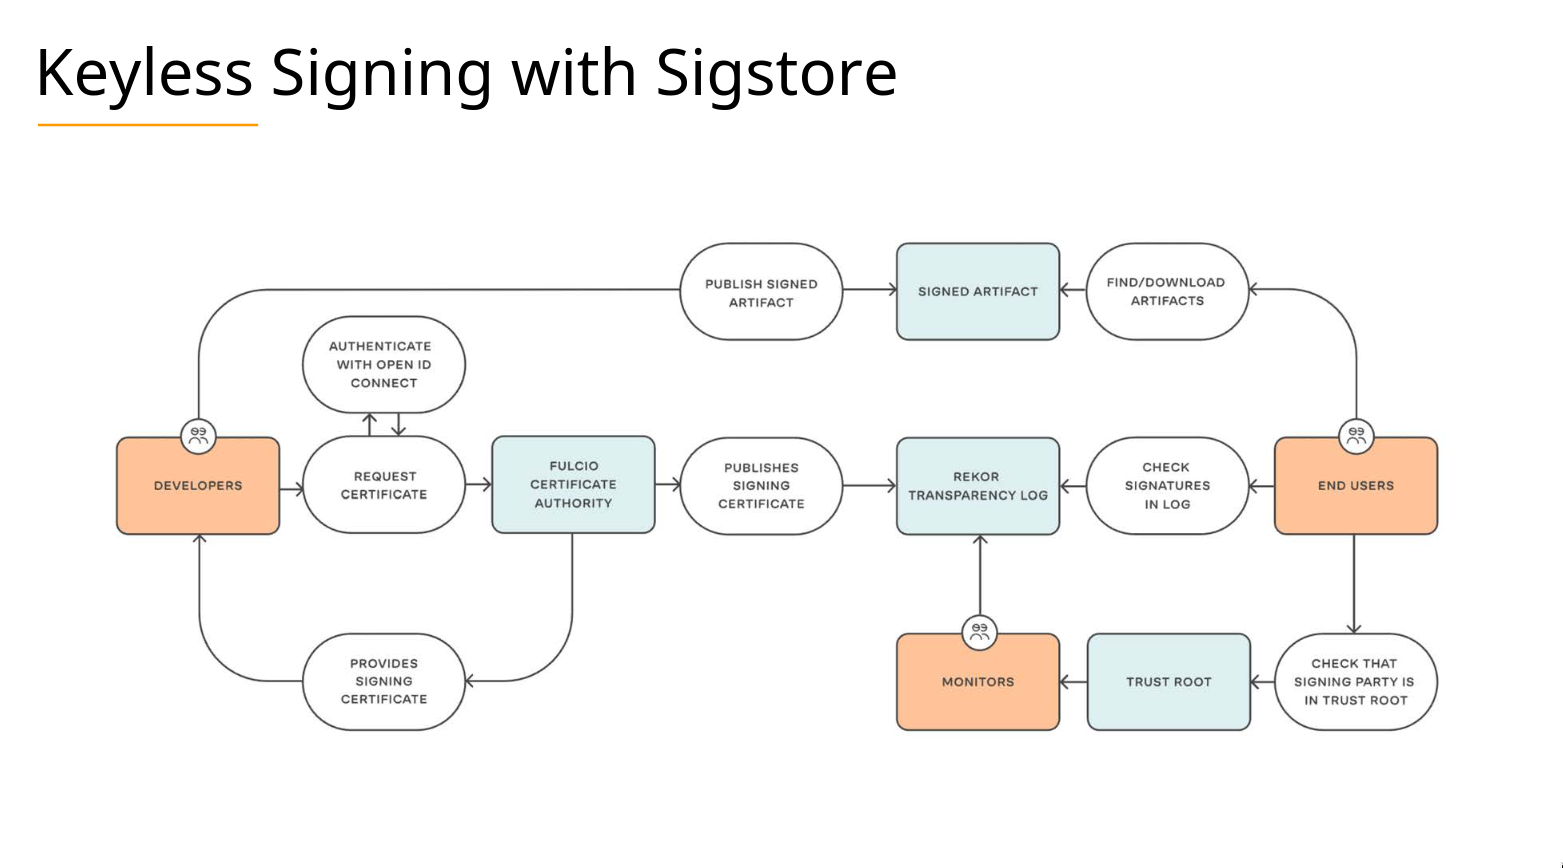 Slide from Nico Meisenzah and White Duck
Last there is a Tetragon - a component for runtime, eBPF-based (extended Berkeley Packet Filter) security observability and runtime enforcement. It is able to detect and react to security-significant events, such as process execution events, system call activity, I/O activity including network & file access.
Profiling in the Cloud Native Era
Talk by Matthias Loibl.
Profiling is a form of dynamic program analysis that measures resource consumption, for example: space (memory), time complexity, usage of instructions, frequency and duration of function calls.
There are two modes. Tracing - record everything, has high costs; and sampling - sample for certain duration or periodically observe some state, for example function call stack - which has lower costs.
Unfortunately, the talk was for go and advertised pprof which has extremely limited functionality for Java. As Java guys we could look into different java profilers such as Java Flight Recorder or others, - comment by me.
At Google they use continuous profiling to save costs, to be able to compare differences between versions, and to understand root causes leading to incidents.
Another tool mentioned in this talk is Parca - a continuous profiling tool for measuring CPU, memory usage over time, and obtaining stack traces down to the line number.
Its’ features include eBPF profiler, that can automatically integrate and discover targets from Kubernetes, working with low overhead. It is a single statically linked binary, that has a built-in storage.
A Parca Agent is an always-on sampling agent.
Parcas’ Storage is inspired by Prometheus; it is a separate meta data store; handles stack traces in the storage; and is called a FrostDB - an embeddable column database.
Speeding up Maven, Gradle, and Jenkins With a Build Cache
A talk and a self-promotion by Gradle Enterprise, where they advertise, well, Gradle Enterprise, and it’s build cache model that allows you to re-compite and re-test only the changed parts of your projects, instead of everything. It works in your local environment, and it can be integrated with CI/CD system, speeding up your development cycle.
Scaling: From 0 to 20 Million Users
Last, but not least, I would like to highlight a talk by Josip Stuhli from Sofascore. This presentation does not have any slides uploaded, however, I was able to find a YouTube recording from UK conference, not sure if it’s the same one. Anyway, I’ll go in from the notes that I took at the time of listening.
This wasn’t a technical how-to talk, more of a life story of a product, from the perspective of a CTO who worked on it for 10 years.
Main points were that the growth in user base required them to use caching, and for that they picked a Varnish, that has requests coalescing feature among others.
At one point they gave in to the hype and switched to MongoDB from MySQL. “Everything worked great, until it didn’t” - later they stumbled with replication issues, locking, foreign keys, data type errors, and difficulties to analyze data. In the end, they migrated back to the world of relational databases and picked PostgreSQL.
As the user count grew, caching got less and less efficient (several cache servers knocking on one machine, which, in turn, becomes a single point of failure. The solution to that became sharding. 1 layer cache, url-based rules deciding to which machine to forward requests.
Then, AWS became the issue. “Cache doesn’t need to be in the cloud”, - decided Josip and moved the cache layer to a number of dedicated VPS servers. Monthly, predictable fee, 10x price reduction compared to Amazon.
Another problems were with countries - while in Europe internet is fast, in some places of India it might be a problem “I didn’t even know that we have a spinning loader in our applicaiton”.
Do you know that buildings can catch fire? Because I didn’t. Anyway, here’s a photo of our HQ burning with all the servers we had in it.
A quote by Josip
Then, for collecting all sorts of events and data, they got ClickHouse - a column based data storage, developed by Yandex. (“Yandex is like Russian Google”).
Outtakes - for scalability you need to be stateless wherever it is possible, know how your users interact with your app, “I assure you - you can always use cache”.
A company product is maintained by under 10 developers.
Books recommendations
- The Kubernetes Operator Framework Book by Michael Dame
- The Go Programming Language by Alan A. A. Donovan and Brian W. Kernighan
- Kubernetes Programming with Go by Philippe Martin
- Accelerate DevOps with GitHub by Michael Kaufmann (I got a chance to talk with him!)
Outro
Congratulations for reaching the end of this synopsis. I hope you liked it. I do not own any